


Space Omics - Exploring The Effects of Spaceflight On Human Biology
Levering Multi-Omics Data To Explore The Effects Of Spaceflight On Human Biology


An ask: If you liked this piece, I’d be grateful if you’d consider tapping the “heart” ❤️ in the header above. It helps me understand which pieces you like most and supports this newsletter’s growth. Thank you!
🧬 Introduction
I recently had the privilege of presenting to NASA GeneLab’s Alzheimer’s Disease and Brain Resilience Analysis Working Group, where I discussed multi-omics data analysis. This article highlights the key takeaways from my talk.
The effects of spaceflight on biological systems are profound, impacting multiple "omics" layers: genomics, epigenomics, transcriptomics, proteomics, metabolomics, and phenomics. Each of these fields provides unique insights into how the body responds to the extreme environment of space, including microgravity, radiation, isolation, and altered circadian rhythms. Furthermore, each of these “omics” data types capture biological information at different points in space (i.e.m different tissues, cells, and subcellular compartments) and time from stable, long-term, data like DNA sequences to dynamic short term responses with metabolites.
In order to make sense of multi omics data and understand how different stressors, like microgravity and space, impact a biological system or to effectively use this data to identify/create biomarkers, we need to understand how it all fits together. In this article, we’ll explore the different multi omics data types, what they can tell us about the effects of space flight, and the time scales on which these changes occur. We’ll also explore potential cause and effect relationships between them before discussing specific challenges we may encounter when analyzing multi-omics data.
🧬 An Overview of Multi-Omics Measurements
Understanding multi-omics data begins with exploring what each data type represents independently and recognizing the unique timescales over which each biological process operates. We can then explore the potential effects of space flight at each level of biological organization, and how they relate to one another.

The logical place to start is with genomics. At the foundational level, genomics focuses on the DNA sequence, capturing the complete genetic blueprint of an organism. Many of us are already familiar with DNA sequencing through DNA testing services like 23andMe, Ancestry, and Nebula Genomics. Other examples or genomic testing include whole exome sequencing, which sequences the protein coding regions of DNA to identify disease causing variations, and FISH (Fluorescence in situ hybridization), which is a technique that uses fluorescently labeled DNA probes to identify and locate genetic mutations and chromosomal abnormalities.
Unlike other omics data types, the genome remains largely stable over time, with its structure rarely altered by short-term environmental changes. However, spaceflight creates notable exceptions; exposure to high levels of ionizing radiation, for instance, can damage DNA, accelerate mutation rates, and shorten telomeres, contributing to aging and health risks in astronauts, as depicted in the image below (techniques like next generation sequencing do not directly identify DNA breaks, which can be induced by radiation, but can instead be used to detect the downstream consequences of DNA breaks or other structural variations in the genome such as double strand breaks. ).

Genomics analysis often involves examining these genetic variants, linking them to specific traits or health outcomes in genome-wide association studies (GWAS), and identifying networks and pathways that may play a role in biological processes.
Moving beyond DNA, epigenomics offers a dynamic layer of information, revealing how the genome is regulated and interpreted. In other words, epigenomics focuses on changes to gene expression regulation that do not involve altering the underlying DNA sequence. This regulation occurs through mechanisms like DNA methylation and histone modification, which can change in response to environmental factors, such as the unique stressors encountered during spaceflight. Microgravity and radiation exposure, for instance, can disrupt typical epigenetic patterns, influencing gene regulation in ways that may have lasting effects on an astronaut’s biology, even after they return to Earth.
Capturing epigenomic data at any given moment provides insights into the cell’s near-term plans, revealing which genes are accessible and actively prepared for transcription in response to current conditions. This is a powerful way to see how external factors, such as spaceflight’s physical and environmental challenges, influence gene expression over time. Epigenomic analysis typically includes methods like peak calling, differential peak analysis, and pathway enrichment analysis. Peak calling identifies areas of the genome where regulatory elements are actively interacting with DNA, while differential peak analysis compares these regions across different conditions, helping to highlight where significant changes in gene regulation occur1. Pathway enrichment analysis then ties these modifications to specific biological pathways, providing insight into the functional consequences of altered gene activity under unique conditions like spaceflight.
Transcriptomics, which measures mRNA levels, goes a step further by providing a real-time snapshot of gene expression in response to internal and external cues. This data shows us the cell’s immediate intentions—genes actively being transcribed in reaction to a given environment. For instance, performing RNA sequencing on astronaut samples can reveal changes in gene expression directly tied to spaceflight stressors. However, transcriptomics offers only a glimpse of what the cell is preparing to do, not the proteins it has already produced. In spaceflight studies, differential expression analyses and functional enrichment methods help researchers interpret these gene expression changes, revealing patterns that highlight how space conditions impact various biological systems.
Proteomics, meanwhile, examines the full set of proteins present in a sample, capturing the cell’s recent history and ongoing activities. While transcriptomics reveals which genes are transcribed into RNA, proteomics identifies which of these transcripts are actually translated into functioning proteins. Since proteins are the functional molecules in cells, their levels and modifications can provide insight into the cell’s activities and response to its environment. Proteomic data thus represents a crucial link in understanding how the cell is adapting to its circumstances. Spaceflight can alter protein abundance, structure, and post-translational modifications, which affects cellular function and overall astronaut health. Analyzing proteomic data involves measuring protein abundance, mapping their spatial localization, and understanding their roles in biological pathways.
At the metabolic level, metabolomics captures small molecules—metabolites—that drive cellular reactions. This data type provides a real-time view of metabolism, showing which biochemical reactions are currently occurring within the cell. For example, metabolomic data collected from astronauts could reveal shifts in lipid metabolism, including an increase in circulating fatty acids, which may relate to the body’s energy demands and muscle adaptations under microgravity. Studies have shown that spaceflight can also increase levels of reactive oxygen species (ROS), leading to oxidative stress and damage to proteins, lipids, and DNA. Metabolomics offers a direct view into these biochemical pathways, helping us understand the immediate physiological effects of space conditions.
The image below, taken from a study titled Metabolic Dynamics In Short- and Long-Term Microgravity In Human Primary Macrophages does a nice job at visualizing differentially expressed metabolites. Specifically, the figure shows a comparison of metabolite abundances in TEXUS-54 (A) and CELLBOX-PRIME (B) experiments versus ground controls. Each bar plot represents individual metabolites relative abundances between the two conditions, providing a clean comparative visualization.

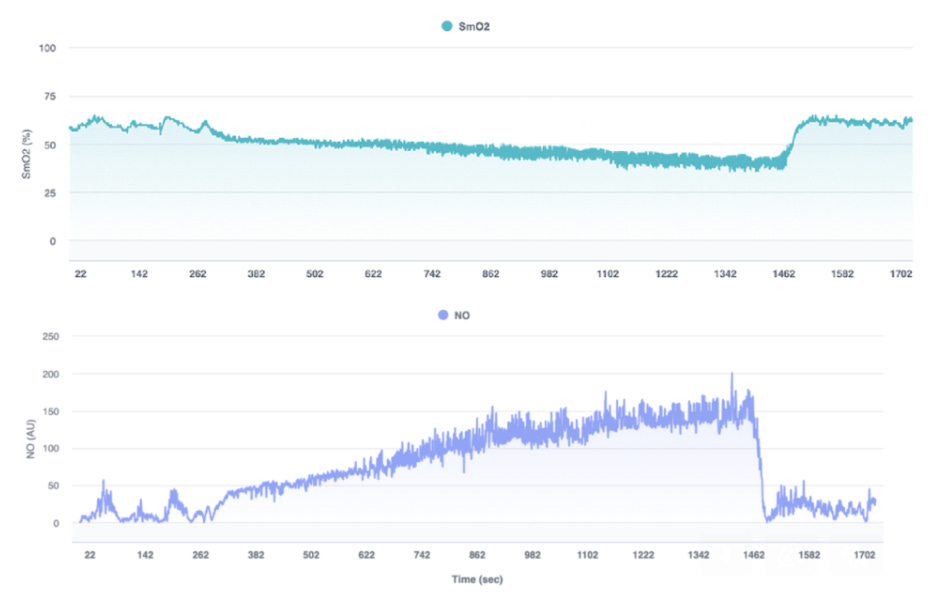
Finally, phenomics encompasses the broad range of observable traits, from physiology to behavior, that result from interactions across genomic, epigenomic, transcriptomic, proteomic, and metabolomic layers. Phenomics can include stable characteristics, like height, or immediate physiological responses, like heart rate variability. In spaceflight, astronauts experience changes in physical, cognitive, and behavioral traits due to factors like microgravity and isolation. Phenomics provides the integrative perspective needed to understand how these molecular changes translate into observable, whole-organism effects. In my work, for instance, I often analyze time-series physiological data assess the effects of exercise and environmental stressors on local muscle physiological responses, as demonstrated in the image below.
By exploring these layers of omics data, we can begin to assemble a detailed picture of how the body reacts to spaceflight. Each data type offers unique insights into specific processes, yet together, they provide a more comprehensive understanding of the complex, multi-layered adaptations needed to survive—and thrive—in space. This integrated view is invaluable for developing biomarkers and strategies that promote astronaut health and resilience.
🧬 Exploring Cause-and-Effect Relationships in Multi-Omics Data
Having defined the different omics measurements, we can begin to explore how they might connect through cause-and-effect relationships. At a high level, each omics layer represents a distinct tier of biological information, linked in a sequence that spans multiple timescales. For instance, the regulation of gene expression captured by epigenomics often shapes transcriptomic activity, determining which genes are expressed and thereby setting the stage for subsequent protein production. Likewise, transcriptomic data reflects preparatory steps toward protein synthesis, which is then captured by proteomics as it tracks the actual proteins at work in the cell. Proteins, in turn, drive metabolic processes, which can be measured through metabolomics. Theoretically, this chain of interactions—from DNA through proteins and metabolites—should reveal a coherent flow of biological events.
In practice, however, this clear-cut sequence is often harder to establish. Different omics layers don’t always fall into neat predictive chains, especially since data is often collected simultaneously across these layers rather than sequentially over time. Given this, it can be more useful to view these omics types as complementary snapshots, each adding a different piece to a larger picture when captured together.

A practical framework to understand this interplay begins with genomics, which provides the cell’s underlying potential—what it can do based on its DNA. Epigenomics and transcriptomics then reflect what the cell is getting ready to do, capturing preparatory stages that regulate and initiate gene expression. Proteomics follows, giving insight into what the cell has been doing, by revealing the proteins actively produced and utilized in response to recent needs. Metabolomics, meanwhile, shows what the cell is doing right now, offering a live view of its metabolic activities and energy state. Finally, phenomics provides an integrated readout of these molecular layers, manifesting in observable traits and characteristics that reflect the biological outcomes of all these underlying processes.
In this way, each omics layer contributes uniquely to our understanding of the biological state, helping to link molecular activity with visible traits and functional outcomes, which i’ve discussed at length in a previous article titled, Connecting The Dots: Understanding the interrelationships between genomic, epigenomic, transcriptomic, proteomic, metabolomic, phenomic, and stimulus data.
🧬 Exploring Similarities and Differences Between Space Flight Conditions and Alzheimer’s Disease
A key objective for the Alzheimer's Disease and Brain Resilience Analysis Working Group is to uncover the overlapping features between Alzheimer’s disease and spaceflight-induced neurodegeneration. By understanding these commonalities, the group aims to develop approaches that could potentially bolster resilience against neurodegeneration, with the long-term goal of mitigating Alzheimer’s disease progression. The first step in the project road map involves conducting a comprehensive analysis of differentially expressed genes (DEGs) by comparing three groups of mice:
Alzheimer’s Disease (AD) Mice vs. Control Mice: This comparison will identify gene expression changes specifically associated with Alzheimer’s pathology, helping us understand the molecular alterations driving the disease.
Space-Exposed Mice vs. Control Mice: By analyzing the gene expression differences here, we can pinpoint changes linked to the space environment, such as microgravity and radiation, which may influence neurodegenerative processes.
AD Mice vs. Space-Exposed Mice: Directly comparing these two groups allows us to explore the unique and shared impacts of Alzheimer’s pathology and space-related stressors on gene regulation.
To identify DEGs and understand the regulatory mechanisms involved, both bulk RNA-sequencing and single-cell RNA-sequencing can be employed to capturing gene expression patterns. Additionally, by analyzing available ChIP-seq or ATAC-seq data, it’s possible examine potential epigenetic changes associated with both AD and space exposure, gaining insights into how these conditions might alter gene regulation. This analysis, however, comes with anticipated challenges, which I’ve outlined below:
Strain-Specific Effects: The genetic background of the mice can heavily influence gene expression, potentially confounding our results if strain differences are significant. To address this, datasets from consistent mouse strains, such as C57BL/6, can be prioritized to ensure that comparisons remain valid. Additionally. strain-specific DEGs can be examined to better account for strain differences statistically to isolate relevant findings.
Batch Effects: Variability from different experimental batches, such as tissue processing or sequencing, can introduce noise, obscuring true biological signals. To mitigate these effects, batch harmonization techniques can be applied, which align gene expression distributions across batches and reduce unwanted variation. Batch identifiers can also be included as a covariate in statistical models, ensuring that any observed gene expression changes are biological rather than artifacts of batch variability.
Environmental Variability: Differences in mouse handling, housing, or environmental conditions could influence gene expression. While difficult to avoid, strict protocols can be used to standardize conditions across samples and incorporate environmental metadata where available to control for these variables.
Data Availability and Quality: Access to high-quality datasets for specific comparisons, particularly for ChIP-seq or ATAC-seq, can be limited. To ensure comprehensive coverage, a extensive literature review and data mining can be performed. We’ll also reach out to other research groups for data collaboration, using only well-annotated, high-quality datasets in our analyses.
In the remaining portion of my talk I covered sample workflows for working with different types of multi-omics data, with specific examples using data from NASA GeneLab’s Open Science Data Repository. You can find the sample code for one of my analysis here.
If you’d like to receive a copy of my presentation slides, which this article is based on, you can shoot me an email at evanpeikon@gmail.com with the subject line “Space Omics Slides”.
More in depth explainer: Peak calling is the process of identifying regions of the genome where DNA is bound by proteins (like transcription factors) or where chromatin is accessible for gene expression. These regions appear as "peaks" in sequencing data, representing areas of high signal intensity. For example, in a ChIP-Seq experiment, peak calling helps locate specific DNA regions where proteins (e.g., histones or transcription factors) interact with DNA. Differential peak analysis, on the other hand, compares peak signals between different conditions (e.g., ground vs. spaceflight samples) to identify changes in DNA accessibility or protein binding. This analysis reveals whether certain regions of the genome are more or less accessible or bound in one condition versus another, helping to understand how environmental factors like spaceflight might influence gene regulation.