


Connecting the Dots: A Guide to Multi-Omics Data
Understanding the interrelationships between genomic, epigenomic, transcriptomic, proteomic, metabolomic, phenomic, and stimulus data

An ask: If you liked this piece, I’d be grateful if you’d consider tapping the “heart” ❤️ in the header above. It helps me understand which pieces you like most and supports this newsletter’s growth. Thank you!
I first became interested in bioinformatics and computational biology while pursuing my master’s degree in medical physiology and pharmacology. Although I had a solid background in cell and molecular biology, I was quickly overwhelmed by the sheer volume and variety of data that bioinformaticians must navigate—genomic, epigenomic, transcriptomic, proteomic, metabolomic data, and more!
Without a clear mental model for how these different data types relate to one another, gaining a firm understanding of the field was challenging. I initially focused heavily on next-generation sequencing (NGS) data, including DNA sequencing, bulk RNA sequencing, and single-cell RNA sequencing, often at the expense of exploring other omics technologies. However, it soon became apparent that to tackle the research questions I was investigating, I needed to familiarize myself with ChIP-seq, ATAC-seq, and other data types. This realization pushed me to develop a comprehensive framework for understanding these various data types.
In this article, we’ll explore the mutual information shared between different omics data types, the biological processes and stimuli that trigger changes in these measurements, and the timescales on which these changes occur. We’ll also examine potential cause-and-effect relationships among the different types of measurements. By delving into these topics, we aim to provide a holistic understanding of how various omics measurements and technologies interconnect, equipping you with a strong mental model for interpreting multi-omics research and analyzing new data.
🧬 An Overview of Multi-Omics Measurements and Their Timescales
The first step to understanding multi-omics data is to grasp what each data type represents in isolation and recognize the different timescales on which each biological process operates. In this section, I’ll explain what each type of data represents and what it means if you capture that data at a specific moment in time.
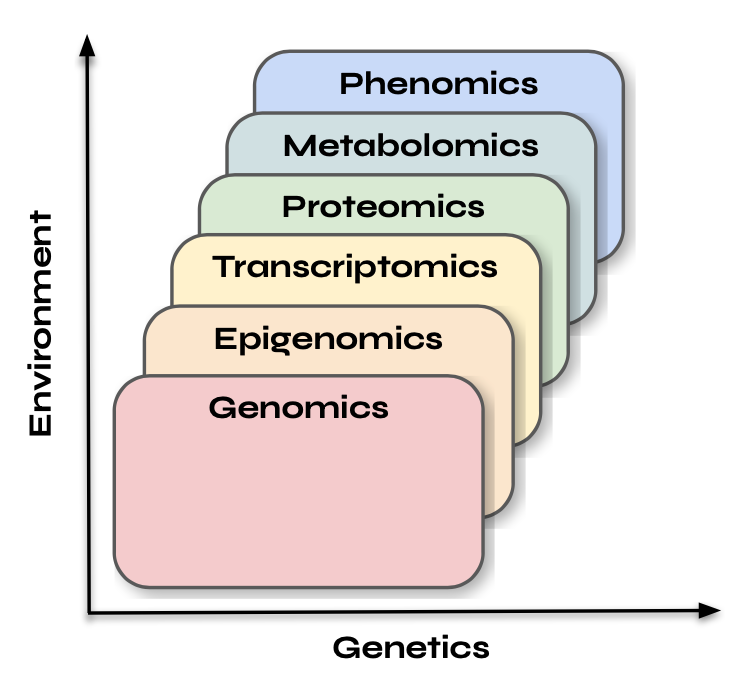
Genomics data represents the complete set of DNA, or genetic material, within an organism. If you’ve ever used services like 23andMe or Nebula Genomics, you’re familiar with basic concepts of DNA testing. Genomics is essentially the blueprint that defines an organism’s potential—its inherent capabilities and traits. I like to think of genomics as the landscape upon which other layers such as epigenomics, transcriptomics, proteomics, and metabolomics operate. Another way to view it is that the genome sets the boundaries, while the other layers reflect how that potential is realized or modified in response to internal and external factors. Genomic information remains fairly static over time and is generally not influenced by environmental changes in the short term. Therefore, the timing of genomic data capture doesn’t matter as much as it does for other data types, as depicted in the image below.
While genomic data provides the blueprint, epigenomic data reflects how that blueprint is being read and interpreted. Epigenomic data, like ChIP-seq and ATAC-seq, provides insights into chromatin accessibility and transcription factor binding—indicating which regions of the genome are "open" for transcription and potential gene activation. It identifies which genes are poised for expression in response to specific signals, reflecting how external factors influence gene expression. If you were to capture epigenomic data right now, it would indicate what the cell is preparing to do or might do shortly, based on which genes are active or accessible for transcription.
Transcriptomics measures mRNA levels, showing which genes are actively being transcribed in response to stimuli. Essentially, transcriptomic data reflects the cell’s immediate plans—what it’s preparing to do based on gene expression in reaction to environmental or internal conditions. For instance, if you perform RNA sequencing (bulk or single-cell) at this moment, it will give you a snapshot of the cell’s gene expression state, indicating which proteins the cell is getting ready to produce. However, transcriptomics doesn't tell you what the cell is currently doing—only what it’s preparing to do.
Proteomics represents the current state of protein expression. Since proteins are the functional products of gene expression, proteomics tells us what the cell has been doing up until now and what it is currently engaged in. Proteomics provides a snapshot of the proteins that are present at the time of measurement, reflecting ongoing cellular processes as well as the outcomes of past gene expression events. For example, if you took proteomic measurements right now, you’d be able to see which proteins are actively functioning in the cell, giving you insight into the cell's recent history and ongoing activities.
Metabolomics measures the small molecules—metabolites—that are involved in biochemical reactions within the cell. Metabolomics gives you an immediate snapshot of what the cell is doing at that exact moment in terms of metabolism and energy production. This data reflects the cell’s current metabolic activity and is highly dynamic, changing rapidly in response to the environment and cellular demands. If you were to capture metabolomic data right now, it would provide a real-time view of the biochemical reactions that are sustaining the cell.
Finally, phenomics encompasses a wide range of measurements, including physiological, morphological, and behavioral traits. Phenomics represents the outward, observable characteristics of an organism that arise from the interactions between its genome, transcriptome, proteome, and metabolome. If you were to collect phenomic data right now, it could reflect long-term changes (like height, which accumulates over years) or instantaneous physiological responses (like heart rate or oxygen consumption). Phenomics offers a broader, integrative view of how all the molecular layers culminate in observable traits.
By understanding how each of these omics technologies operates on different timescales, we can begin to see how they complement one another, providing a richer, multi-dimensional view of biological systems.
🧬 Exploring Cause-and-Effect Relationships in Multi-Omics Data
In the previous section, we defined various Omics-related terminologies and the associated timescales for different Omics measurements. In this section, we will explore the potential cause-and-effect relationships that can be elucidated through Multi-Omics analysis.
One of the initial questions I encountered while working with Multi-Omics data was whether transcriptomic data, collected in the present, could predict future proteomic states. The reasoning behind this inquiry is straightforward: if transcriptomic data accurately reflects the cell’s current gene expression status—essentially capturing what the cell is preparing to do—then it should correlate with proteomic data collected at a later time point, which would represent future protein expression. Since mRNA serves as the blueprint for proteins, transcriptomics effectively captures the cell's preparatory activities. When genes are transcribed into mRNA, it is often with the intention of translating that mRNA into proteins. In this context, transcriptomics can be viewed as an early indicator of protein production, suggesting forthcoming changes in the proteomic landscape.
However, while the concept of using transcriptomics (mRNA levels) to predict future proteomic states (protein levels) is theoretically sound, it becomes complicated in practice. The relationship between mRNA and protein expression is not perfectly direct or linear. For instance, the measured amount of mRNA does not always correspond directly to protein levels, as some mRNA transcripts are unstable and degrade rapidly. Furthermore, the efficiency of translation varies widely, influencing the rate at which mRNA is converted into protein. Additionally, transcriptomics captures all types of RNA, including non-coding RNAs that do not encode proteins but instead regulate various cellular processes. These non-coding RNAs can indirectly affect protein levels, adding another layer of complexity to predictions. After proteins are synthesized, they often undergo post-translational modifications—such as phosphorylation or glycosylation—that impact their activity, localization, or stability. Since transcriptomics does not capture this level of regulation, accurately predicting the functional proteome becomes more challenging.
One potential solution to these complications is the integration of epigenomic data into predictions of future proteomic states. Epigenomic data can provide critical context for transcriptomic states by revealing which genes are potentially active or repressed at any given time. For example, techniques like ATAC-seq or ChIP-seq can identify accessible chromatin or activating histone marks near a gene promoter, suggesting that a particular gene is more likely to be transcribed into mRNA. By combining current epigenomic data with transcriptomic data, researchers may achieve more robust predictions of future proteomic states.
Another question I pondered early on was how past transcriptomic and proteomic states reflect current metabolomic states. Past transcriptomic states can indirectly predict the current metabolic state because gene expression leads to protein production, which drives metabolic processes. However, due to various regulatory steps between mRNA and metabolite production, this prediction is less direct and often delayed, similar to the challenge of predicting proteomic states from past transcriptomic data. In contrast, proteomic states serve as direct predictors of current metabolic states, as proteins—especially enzymes—are essential for catalyzing metabolic reactions. If we know which enzymes were expressed and active in the past, we can predict the current metabolic activity with reasonable accuracy.
As we analyze these relationships, a pattern begins to emerge. In the chart from the last section, where the x-axis represents genetics and the y-axis represents the environment, our predictive capacity based on past data tends to improve as we move up and to the right. For instance, genetic data serves as a poor predictor of epigenetic data, while past epigenetic data provides a moderate prediction of current transcriptomic states. Similarly, past transcriptomic states can reasonably predict current proteomic states, and past proteomic states are good predictors of current metabolomic states. This observation raises the question of how well we can predict phenotype from other Omics data and whether it follows a similar pattern. The answer is somewhat unsatisfying: both yes and no.
No, because genomic data can effectively predict certain phenotypic states. Yes, because all these Omics layers—metabolomics, epigenomics, transcriptomics, and proteomics—impact phenotype in both direct and indirect ways. While they operate on different timescales, these layers are deeply interconnected, collectively shaping the observable traits and performance capabilities of an organism. By integrating data across these layers, researchers can gain a comprehensive understanding of how various stimuli—such as exercise, diet, drugs, or environmental factors—ultimately shape phenotype.
🧬 Constructing a Multi-Omics Timeline
In the previous sections, we examined the various timescales associated with Multi-Omics measurements and the potential cause-and-effect relationships between them. Specifically, we noted that as we progress through the layers of Multi-Omics data, it becomes increasingly easier to predict current measurements based on past states. However, this understanding presents several challenges. First, it relies on the assumption that we know the past states of various measurements—an assumption that is often unrealistic. Second, predicting current states is not particularly useful in practice, as we already possess that information by definition. Furthermore, this linear conceptualization of Multi-Omics data—often presented as a sequence from genomes to epigenomics to transcriptomics, proteomics, metabolomics, and phenomics—can obscure the intricate relationships among these layers. For instance, it neglects the regulatory role that more "superficial" layers, like metabolomics, can have on epigenomics.
To address these complexities, I prefer to reframe the discussion in terms of stimulus and response. Imagine applying a stimulus at time t=0t=0 and then capturing all relevant Multi-Omics data. What would this data represent? Moreover, if we were to collect additional data shortly after, at time t=1t=1, or even later at t=2t=2, how should we interpret it?
Let’s start with a straightforward scenario. After applying a stimulus and measuring the proteomic state at time t=0t=0, we obtain data that reflects both the near past and the current state of protein expression. Consequently, this proteomic data should be predictive of our metabolic state at t=0t=0 and, even more so, at t=1t=1. The metabolic state measured represents the body’s immediate response to the stimulus, indicating its current activities, while the transcriptomic state reflects the preparations the body is making for future actions. Therefore, we can expect the transcriptomic state to serve as a reasonable predictor of proteomic changes at time t=1t=1.
Moving to time t=1t=1, we obtain a new proteomic state that should relate to our transcriptomic state from t=0t=0, as well as to our metabolic state, which in turn reflects the proteomic state at t=0t=0. Additionally, the transcriptomic state at t=1t=1 is expected to predict proteomic states at t=2t=2.
As previously mentioned, various regulatory factors can impact these relationships. This is where epigenomic data becomes crucial. Techniques such as ChIP-seq (chromatin immunoprecipitation sequencing) and ATAC-seq (assay for transposase-accessible chromatin with sequencing) provide valuable insights into how cells regulate gene expression. Epigenetic modifications shape the pool of mRNAs that can be translated into proteins, offering a predictive layer for future protein expression. Thus, we can refine our understanding of the timescales involved.
At time t=1t=1, the proteomic state should be influenced not only by the transcriptomic state from t=0t=0 but also by the epigenomic state at t=0t=0 (and prior). Similarly, the metabolomic state should reflect the proteomic state at t=0t=0, while the transcriptomic state will be both a reflection of the epigenomic state at t=0t=0 and a predictor of the proteomic state at t=2t=2.
This creates a feedback loop, allowing us to explore chains of causality that can be traced back and forth across these omic layers. These relationships can be formally analyzed using methods such as Granger causality. However, for practical purposes, I find it more useful to break this loop by incorporating stimulus data, which we will discuss in the next section.
🧬 Incorporating Stimulus Data Into Multi-Omics Analyses
To break the causal loop described earlier, I propose incorporating stimulus data into Multi-Omics analysis. This data can encompass a variety of factors, such as exercise metrics (like VO₂, power output, and heart rate), environmental conditions (including altitude, acidity, and CO₂ levels), and external influences such as drugs. Essentially, we need to consider anything that disrupts the system and elicits a physiological response. By doing so, we can establish a clearer chain of causality: Stimulus → Metabolomic Response → Epigenomic Response → Transcriptomic Response → Proteomic Response → Metabolic Response—and so forth. Furthermore, these combined states can serve as predictors for phenomic changes.
However, as we can see, this chain still presents a cyclical nature. This raises an important question: if a stimulus leads to metabolomic changes, which subsequently cause epigenomic, transcriptomic, and proteomic alterations, how will these changes influence future metabolomic responses to the same stimulus applied at a later time? The answer is yes, and this concept is rooted in the principle of adaptation. This explains why the same exercise protocol can yield different responses when performed on separate days or why a repeated drug dose may not affect the body identically each time.
Let’s delve into this idea with a practical example. Consider a rigorous exercise session. Metrics such as power output, heart rate, VO₂, and lactate levels provide immediate indicators of physical exertion and energy expenditure. These metrics reflect real-time physiological demands, which directly influence the body’s biochemical pathways responsible for energy supply.
During exercise, the changes in energy demands—such as glycolysis and oxidative phosphorylation—will have an immediate impact on the metabolome. Energy substrates like glucose, glycogen, lipids, and ATP are either consumed or generated in response to the intensity and duration of the exercise. Additionally, these metabolomic changes occur immediately during and after the exercise, representing the cell's real-time metabolic activity.
Certain metabolites also serve as cofactors for enzymes that modify the epigenome, thereby influencing gene regulation. For instance, acetyl-CoA, a byproduct of metabolism, acts as a substrate for histone acetyltransferases (HATs), which modify histone proteins and promote gene expression. Similarly, NAD⁺ levels affect the activity of sirtuins, proteins involved in histone deacetylation, which are associated with longevity and metabolic adaptation.
As metabolite concentrations fluctuate during and after exercise, these metabolites can modify chromatin accessibility and gene expression by influencing histone modifications and DNA methylation patterns. For example, exercise may induce specific epigenetic changes in skeletal muscle, leading to long-term modifications in gene expression related to endurance or strength adaptations. Changes in the epigenome resulting from shifts in metabolite levels could manifest over hours to days, as transcription factors and chromatin remodelers adjust to new metabolic states.
The epigenome plays a crucial role in regulating DNA accessibility for transcription. Variations in histone acetylation, methylation, and DNA methylation directly impact the transcriptome by modulating the activation or repression of gene expression. Additionally, exercise-induced epigenetic alterations can lead to changes in the expression of genes involved in energy metabolism, mitochondrial biogenesis, muscle hypertrophy, and inflammation. These transcriptional changes may reflect both acute responses to exercise (such as stress response genes) and longer-term adaptations (like genes associated with muscle remodeling or endurance). These transcriptomic changes can occur within hours after exercise, as the cell responds to signals initiated by the immediate metabolic environment and the longer-term epigenetic landscape.
Following transcriptional changes, the exercise-induced mRNAs are translated into proteins. These proteins may include enzymes that facilitate metabolism, structural proteins for muscle fibers, and signaling proteins that aid in recovery and adaptation. The synthesis and accumulation of proteins in response to exercise typically occur over hours to days after transcription, depending on the specific protein and the regulatory mechanisms involved. For instance, metabolic enzymes may be produced relatively quickly, while structural adaptations like muscle hypertrophy could take longer to manifest.
These layers are likely to interact through feedback loops, especially in response to repeated exercise stimuli (such as during training). Over time, the cumulative effects of the exercise can lead to long-lasting shifts in the epigenome and transcriptome, fostering more enduring adaptations in the proteome, metabolome, and overall cellular function.
This is a wonderful post that overviews the relationship between all the omics (genomics, epigenomic, ... metabolomic), most of all it explains the "bigger picture" on how they relate to each other. Evan simplifies biology concepts for the average reader and adds analogies that clarified my understanding and made me want to read more about bio :) - thank you Evan!