


Dampening the Noise: Making Sense of Variability In Biometric Measurements
Biometric readings vary over time. Understanding what fraction of these variations represent true biological changes reveals insights into the body's adaptive responses.


Liked this piece? Show your support by tapping the “heart” ❤️ in the header above. It’s a small gesture that goes a long way in helping me understand what you value and in growing this newsletter. Thanks so much!
Biology is messy. Measuring biological systems is even more so. When measuring living system we face a grand challenge — we want to capture true variations in biological signals, yet we also need to consider the limitations of our measurement tools, potential failure modes, and the way our observations can actually impact what we are trying to measure.
This article explores practical solutions to these challenges, in parsing signal from noise, using muscle oximetry as a case study. However, the same concepts apply more broadly to biometric measurements in general. Let’s dive in.

Making Sense of Variations In Biometric Signals
A few months ago I was consulting on a project for a ''human performance'' group that was trying to understand the effects of different environmental conditions (extreme heat/cold, high altitude, etcetera), dietary interventions (carb to fat ratios, exogenous ketone supplementation), and human-equipment interfaces on skeletal muscle bioenergetics. Part of this project involved having test subjects repeat identical exercise-based stress tests on different days and comparing their muscle oxygenation, oxygen consumption, and blood lactate measurements while manipulating one or more of variables mentioned above.
As expected, some of the variables we tested, like decreasing the oxygen concentration of air, resulted in significant changes to the aforementioned biometrics — tweaking other variables, like supplementing with exogenous ketones, had less of a notable effect. In both cases, our confidence in the result was inversely proportional to the trust we had in our biometrics data, and the ability to parse true biological variations in the signal from noise.
From biosensor placement to changes in blood chemistry, fitness, and fatigue, understanding all of the factors that can influence biometric measurements, like muscle oxygenation, can help us better interpret our collected data and make more informed judgements and decisions based on it. In the next section we’ll start exploring the why’s behind variations in muscle oxygenation (SmO2) signals and how we can meaningfully interpret them.
Muscle Oxygenation is a Reflection Of Tissue Stress, Not a Measure of It
Muscle oxygenation is often thought of as a measure of tissue-stress, or exercise intensity. This isn’t quite right. Changes in muscle oxygenation are associated with changes in exercise intensity, but they are not one and the same. A better way to think about muscle oxygenation is as a reflection of tissue stress, or a measure of our bodies response to changes in exercise intensity. This delineation seems pedantic, but it’s crucial to understanding changes in muscle oxygenation measurements.
At its core, muscle oxygen reflects the balance of oxygen supply and demand in skeletal muscle. Under most circumstances, increasing exercise intensity increases a muscle’s demand for oxygen relative to its supply, and as a result muscle oxygenation decreases, as demonstrated in the image below. However, this isn’t always the case — there are times when increases in exercise intensity1 are not met by decreases in muscle oxygenation — in fact, increases in intensity can be met by stable or increasing SmO2, which could be due to increased muscle blood flow, or changes in muscle recruitment patterns, among other factors.

When you consider that muscle oxygenation reflects our body's response to exercise intensity, and is not a measure of intensity itself, you can appreciate one of the more interesting aspects of the measurement — how it varies day-to-day in response to similar loads or stressors.
In the next section we’ll explore the difference sources of variation in muscle oxygenation signals and how clever biosensor design and data processing can eliminate unwanted sources of variation while exposing those that are most information rich. We’ll also dive into a topic that is often confusing for consumers, who don’t understand all of these sources of variation, which is the challenge of comparing muscle oxygenation measurements across different mNIRS2 sensors like MetaOx, NNOXX, Moxy, Humon, and TrainRed.
Sources of Variability in Muscle Oxygenation Signals
Imagine the following scenario: we have a test subject in a lab, where heat and humidity are controlled, perform the exact same interval workout on two separate days. In both cases they are wearing an mNIRS device on their outer quadriceps. When comparing the subjects data across sessions though, we notice that their muscle oxygenation trends look totally different, despite the traces of their power output perfectly matching one another. One day they have large dynamic changes in their muscle oxygenation level, and the other day it’s relatively static with compressed ranges. Why did this occur? And, does it indicate a meaningful difference in their physiology between the two test sessions?
To answer the question posed above we first need to understand the potential sources of variation in muscle oxygenation signals, which can broadly be lumped into three groups:
Device-related factors: device placement, ambient light shielding, device to skin-coupling, external compression.
Tissue-related factors: muscle damage, muscle fiber recruitment, fitness-dependent changes to muscle physiology.
Blood chemistry-related factors: temperature, acidity (H+ concentrations), CO2 levels and 2,3-DPG levels in blood, nitric oxide bioactivity.
Of these different categories listed above, device-related factors are the sources of variation we want to minimize to the greatest degree possible. These are largely related to device placement, how the device is donned, and the form factor of the device, which can make it more or less sensitive to the above. Tissue and blood chemistry related factors, on the other hand, biological sources of variation we want to zoom in on and assess.
Notably, all of the factors listed above are intra-individual sources of variation in muscle oxygenation measurements, and as a result they explain why a given individual may see differences in their SmO2 levels on two different days where they perform the same exercise routine or assessments. However, there are also inter-individual sources of variation that impact SmO2 readings such as differences in adipose tissue thickness, muscle cross-sectional area, and muscle-tendon insertion points, all of which can make it challenging to compare readings between two individuals with different anthropometrics3.
Device-Related Impacts On Muscle Oxygenation Measurements
There are multiple potential device-related sources of variation in muscle oxygenation measurements. While some of these sources of variation, like device placement, seem to be limitations of mNIRS technology, they actually provide valuable insights into muscle physiology.
Muscles are remarkably heterogeneous in their oxygenation patterns, with different regions showing distinct changes in oxygen kinetics during exercise. This heterogeneity exists because different regions within a given muscle can be recruited differently during exercise. Additionally, blood flow distribution varies across a given muscle, and muscle fiber-type distribution isn't uniform, as made clear by the infrared thermogram below. A muscle fibers proximity to a major blood vessels can also impact local oxygenation readings.

All this means that even a few inches different in mNIRS sensor placement can yield different absolute SmO2 values — the difference between a baseline reading of 57% vs. 62%. Additionally, there's natural asymmetry between left and right sides of the body, so measurements taken on different legs or arms may show consistent variations. This variability provides valuable information about regional muscle recruitment patterns and local tissue characteristics.
External compression represents another potential source of variation in muscle oxygenation measurements. Compression can affect measurements both through direct influence on local blood flow and by altering the optical coupling between the sensor and skin. Excessive compression can restrict blood flow in the measured area, potentially leading to lower SmO2 readings. However, more modern mNIRS devices like NNOXX, have been designing to minimize these effects, as demonstrated below:

The final major source of device-related variations in muscle oxygenation measurements comes from ambient light interference. Ambient light can contaminate an mNIRS device signal if it reaches the photodiodes coupled to the skin, potentially creating measurement artifacts. Most modern mNIRS devices have engineering their form factors to make this a non-issue. The NNOXX sensor has a convex bottom, improving sensor-skin contact, is attached with a strap that acts as a secondary light shield, and employs signal processing algorithms to minimize light interference.
Finally, as a practical aside, to ensure consistent muscle oxygenation measurement mNIRS sensor users should established set device placement using anatomical landmarks as reference points and maintains consistent attachment methods across sessions. By understanding and controlling for these device-related sources of variation, more reliable data can be captured. Additionally, these careful considerations when donning a device allow users to differentiate actual physiological changes from measurement artifacts, ultimately providing more valuable information and insights.
Tissue-Related Impacts On Muscle Oxygenation Measurements
Among the factors that influence muscle oxygenation readings, tissue-related factors have the most profound impact. These factors are of particular interest as they reflect meaningful changes in how our bodies adapt to and respond to exercise and environmental stressors over time. The most immediately noticeable tissue-related factor impacting muscle oxygenation is exercise intensity— this is somewhat obvious, given that monitoring intensity is the primary use case for muscle oximetry.
However, while it's tempting to think that performing the identical workouts on different days should produce the same physiological responses, the reality is far more complex. The body’s response to a given external stressor, like cycling at 250 watts, can significantly vary based on its current physiological state. Things like sleep quality, nutritional status, cumulative training load in the preceding days, muscle damage, and overall stress levels all influence how muscles respond to a given stimulus. This means that even when external load metrics like power, speed, or weight remain constant, internal load — as reflected by muscle oxygenation — may differ substantially between sessions.

Changes in muscle mitochondrial and capillary density — signs of altered fitness— represent another important source of variation in muscle oxygenation readings over long(er) periods of time. These adaptations often result in different SmO2 patterns during standardized workouts. For instance, a well-trained athlete might maintain higher SmO2 levels during fixed-intensity exercise compared to their less-trained state, reflecting improved oxygen delivery and utilization capacity, as shown above.

Additionally, muscle damage— whether as a product of training or injury— can significantly alter muscle oxygenation readings. When muscles are damaged local inflammation can affect blood flow patterns and hemoglobin affinity for oxygen, subsequently modifying the tissue’s ability to utilize oxygen. This altered state may persist for several days following the onset of muscle damage and can manifest with unusual SmO2 response, even during relatively low-intensity exercise.
Perhaps the most nuanced tissue-related factors impacting muscle oxygenation is muscle recruitment patterns. During any given movement, your nervous system coordinates which muscle fibers are activated and in what sequence. These recruitment patterns can vary based on factors like fatigue, technical skill development, and even subtle changes in position or movement mechanics. For example, a cyclist might recruit their quadriceps muscles differently when they're fresh versus fatigued, or when they've recently modified their bike position. These changes in recruitment patterns directly influence local muscle oxygenation and can result in notably different SmO2 readings even when performing seemingly identical movements.
Understanding these tissue-related sources of variation is crucial for interpreting SmO2 data effectively. Rather than viewing day-to-day variations as measurement noise, these differences often provide valuable insights into an athlete's physiological state and training adaptation. By monitoring these patterns over time, users can better understand how their bodies are responding to training stress and make more informed decisions about training intensity and recovery needs. This information becomes particularly powerful when combined with other metrics like heart rate, power output, or perceived exertion, providing a more complete picture of athletic performance and adaptation.
Blood Chemistry-Related Impacts On Muscle Oxygenation Measurements
While device and tissue-related factors are often the most discussed sources of variation in muscle oxygenation measurements, blood chemistry plays an important and often under-appreciated role. Changes in blood chemistry can meaningfully impact how hemoglobin binds and releases oxygen, thereby impacting observed muscle oxygenating readings.
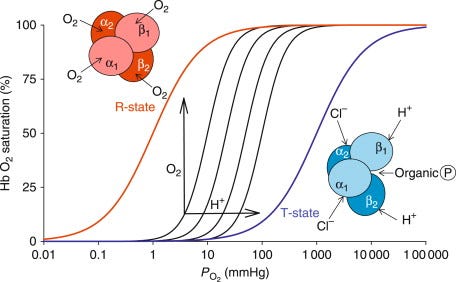
Temperature emerges as a key factor in this interaction. As tissue temperature increases, it triggers a rightward shift in the oxygen-hemoglobin dissociation curve – a phenomenon known as the Bohr effect. This shift makes it easier for hemoglobin to release oxygen to the working muscles, potentially resulting in lower muscle oxygenation readings even if the external workload remains constant. This effect becomes particularly relevant during longer training sessions as core body and tissue temperatures rise.
Blood acidity levels, measured through hydrogen ion (H+) concentration, represent another factor influencing SmO2 readings. During high-intensity exercise H+ concentrations increase, making the blood more acidic and affecting hemoglobin's oxygen-binding characteristics. As H+ increases, and pH decreases, hemoglobin's affinity for oxygen drops, making it more likely to offload oxygen to the tissues.
Carbon dioxide levels constitute the third major blood chemistry factor affecting SmO2 measurements. CO2 accumulation can occur through two primary mechanisms: increased metabolic production of CO2 during exercise and changes in breathing patterns. During high-intensity exercise, both mechanisms typically come into play, with CO2 levels rising due to increased cellular respiration and potentially irregular breathing patterns. The presence of CO2 in the blood leads to the formation of carbonic acid, which further influences hemoglobin's oxygen-binding properties through the Bohr effect.
Importantly, CO2 levels also play a crucial role in regulating nitric oxide bioactivity, a potent vasodilator that affects local blood flow. When CO2 levels rise, they can trigger increased release of bioactive NO from red blood cells, leading to vasodilation and potentially affecting local muscle oxygenation patterns. This creates a feedback loop where breathing patterns, exercise intensity, and blood flow regulation all interact to influence the SmO2 readings we observe.
Understanding these blood chemistry interactions becomes particularly valuable when interpreting SmO2 data during different types of training sessions. For instance, during high-intensity interval training, rapid changes in all three factors – temperature, acidity, and CO2 levels – can create complex patterns in SmO2 readings that reflect not just muscle oxygen consumption, but also the body's overall physiological response to the exercise stress. Similarly, during steady-state endurance training, gradual changes in these blood chemistry might help explain why SmO2 patterns can drift over time even when power output remains constant.
Why Do Different mNIRS Devices Report Different Muscle Oxygenation Values?
While we've explored various sources of variation in muscle oxygenation readings from a given mNIRS sensor, an additional important consideration is why different mNIRS devices often report different absolute SmO2 values even when placed adjacent to one another on the same muscle. This phenomenon deserves careful examination as it impacts how we interpret and compare data across different sensors.
The primary reason for these differences lies in the fundamental engineering choices and algorithms each manufacturer employs in their devices. While all mNIRS devices operate on similar basic principles – measuring the absorption of near-infrared light by hemoglobin and myoglobin – the specific implementation varies significantly between manufacturers. These variations include differences in wavelengths the LEDs emit, the spacing between light sources and detectors (photodiodes), the depth of tissue penetration, and perhaps most importantly, the algorithms used to convert raw optical measurements into muscle oxygenation values.
Consider, for example, a scenario where a Moxy device and a NNOXX device are simultaneously measuring the same muscle during exercise, as demonstrated below. While both devices will typically show similar directional changes in response to exercise – decreasing SmO2 during high intensity and increasing during recovery – their absolute values might differ by 10-15 percentage points. One device might report a baseline of 65% while another shows 75%. During intense exercise, one might drop to 40% while the other reaches 50%. Despite these absolute differences, the relative changes and patterns typically show strong correlations between devices.

These offsets in absolute values don't necessarily indicate that one device is "wrong" – rather, they reflect different approaches to solving the complex challenge of measuring muscle oxygenation non-invasively. Each manufacturer must make engineering trade-offs that balance factors like measurement depth4, signal-to-noise ratio, and the ability to account for individual variations in tissue properties5. Some devices might be optimized for certain tissue depths or particular muscle groups, while others might employ algorithms that are more or less sensitive to individual variations in skin tone or adipose tissue thickness.
Furthermore, the way each device handles confounding factors like movement artifacts, ambient light interference, and changes in blood volume or, blood shunting, can lead to subtle differences in how they respond to various physiological conditions. For instance, some devices might be more sensitive to rapid changes in blood flow, while others might provide more stable readings during movement but potentially miss some faster physiological responses.
This variation between devices underscores the importance of consistency in monitoring – if you're tracking changes over time, it's crucial to stick with the same device and placement location. It also highlights why comparing absolute values between studies or athletes using different devices requires careful consideration. The focus should be on patterns, relative changes, and individual trends rather than absolute values when evaluating muscle oxygenation data across different sensors.
Despite these differences, the fundamental utility of mNIRS devices remains strong. Whether using NNOXX, or another mNIRS device, the ability to track real-time changes in muscle oxygenation provides valuable insights into physiological responses to exercise. The key is understanding the characteristics and limitations of your specific device and interpreting the data within that context, rather than trying to make direct numerical comparisons between different systems.
Did you enjoy this piece? If so, you may also want to check out other articles in Decoding Biology’s Wearable Technology collection.
Here exercise intensity is defined at the % of critical power being used, absolute power output or speed, or external load / resistance.
mNIRS is new term that refers to the subset of near infrared spectroscopy (ie, NIRS) based sensors that specifically measure muscle oxygenation (versus blood oxygenation, or SpO2). Notably, though, there are different types of mNIRS sensors, with the two major categories being frequency-domain mNIRS (FDmNIRS) and continuous wave mNIRS (CWmNIRS).
These inter-individual factors should have little bearing on a given individuals’s day-to-day measurement variability given that they are relatively static over short time frames. However, over longer periods of time (weeks to months) these can become intra-individual sources of variation, obscuring comparisons between measurements (for example, changes in body composition over time can meaningfully impact a given individual’s SmO2 readings — this source of intra-individual variation is most pronounced with mNIRS sensors, which aim to measure 10-20mm into tissue).
Differences in device shape, size, and source-receiver separation distances result in differences in measurement depth and the path that emitted light travels before being picked up by the sensor. As a result, device to device comparisons are rarely “apples-to-apples” comparisons, even when controlling for device placement.
Individual variations in tissue properties include skin and adipose tissue thickness, muscle cross sectional area, melanin concentrations, and the prescence of scar tissue or tattoos.