


Statistical Hypothesis Testing
Is There a Relationship Between Muscle Oxygenation (SmO2) and Peak Power Output?


An ask: If you liked this piece, I’d be grateful if you’d consider tapping the “heart” ❤️ in the header above. It helps me understand which pieces you like most and supports this newsletter’s growth. Thank you!
In a previous article titled, Statistics In Machine Learning, I explained how data is the lifeblood of machine learning systems. In the same way that the blood in our bodies needs to be oxygenated in the lungs before it can breathe life into tissues, data needs to be transformed into information before it can provide meaningful value. Statistics is the art of transforming data into information.
As someone interested in the practical value of machine learning and data science for biomedical applications, the topic of today's newsletter will be highly important. In this article, you'll learn about hypothesis testing and how to use it to determine whether data collected in your experiments is sufficient to support a specific hypothesis. I’ll then present a case study using statistical hypothesis testing to determine whether a cyclist’s minimum muscle oxygenation level during maximal effort exercise is a meaningful predictor of their peak power output.
🧬 Statistical Hypothesis Testing Overview
Data in and of itself is not informative. The analysis and interpretation of data is what gives it meaning. But how do we know if our interpretation of the data is the correct one? This is where statistical hypothesis testing comes in, providing confidence or likelihood about our interpretation.
The term hypothesis has a slightly different meaning in statistics than in the biological sciences. A statistical hypothesis test is a method for calculating a quantity under a given assumption. This assumption is called the default assumption, null hypothesis, or hypothesis zero (H0). Statistical testing aims to either accept1 or reject the default assumption. If we accept the default assumption, we say we fail to reject the null hypothesis. Alternatively, If the default assumption is rejected, we accept the first hypothesis, or hypothesis one (H1), which can more simply be thought of as some other assumption that is not the default.
To determine whether or not we reject the null hypothesis, we must determine whether the findings from our hypothesis test are statistically significant. We can do this by calculating the p-value and then comparing it to a threshold value chosen beforehand called the significance level (α)2.
A common value used for the significance level is 0.05, or 5%. However, smaller values, such as .01, can be used to increase the robustness of your result. If your p-value is smaller than your pre-selected significance level, the null hypothesis (H0) is rejected. Alternatively, if the p-value exceeds the significance level, the null hypothesis is not rejected.
If p-value > α, then the result is not significant (fail to reject H0). If p-value < α, then the result is significant H0 is rejected (H1).3
After determining if a p-value is significant, you can also calculating a confidence level by subtracting the significance level from one.
Confidence level = 1 - significance level.
For example, let’s take two following scenarios. In scenario one, your p-value is 0.04, and your significance level is 0.05, and in scenario two, your p-value is 0.01, and your significance level is 0.02. Your result is statistically significant in both cases, allowing you to reject the null hypothesis. However, you will have two different confidence levels in these scenarios, meaning two different likelihoods that you were wrong to reject the null hypothesis. In the first scenario, your confidence level was 95%, and in the second, it was 98%, meaning the likelihood that you were wrong to reject the null hypothesis was 5% and 2%, respectively.
🧬 Errors In Statistical Hypothesis Tests
The results of statistical hypothesis tests are probabilistic, not deterministic. This is important to remember. You may reject, or fail to reject, the null hypothesis based on the results of the statistical tests you performed, have a high level of confidence in your result and still be incorrect. For example, let’s say your significance level is 0.01. Even if your p-value is below that threshold, there is still a 1/100 possibility that you mistakenly reject the null hypothesis, which is a type I error (i.e., false positive). Alternatively, let’s say your p-value was above your pre-determined threshold, so you fail to reject the null hypothesis. There’s always the possibility that the null hypothesis is incorrect, and in that case, you’d make a type II error (i.e., false negative), as demonstrated in the image below:
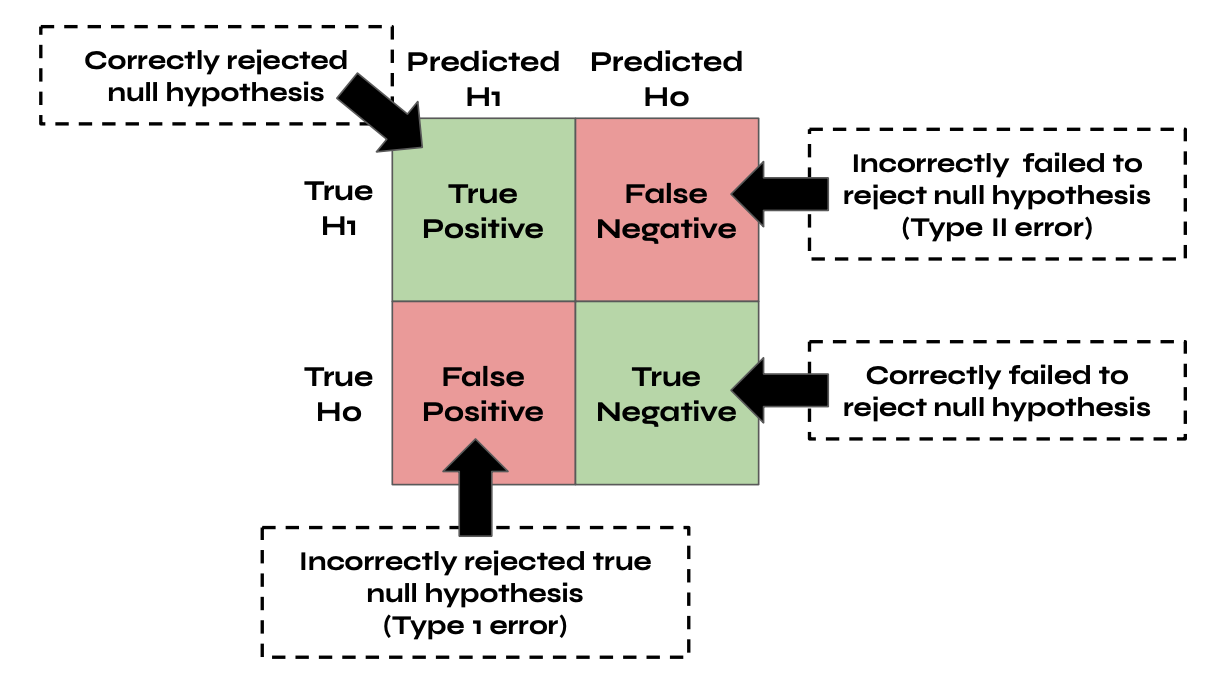
All statistical hypothesis tests have a chance of making both type I and type II errors. The higher we set the significance level, the higher the risk of a false positive, which would mean incorrectly rejecting the null hypothesis. In science, this is called a false discovery. Alternatively, the lower we set our significant level, the higher the risk of false negatives— this means failing to reject the null hypothesis.
Type I errors (false positives) and type II errors (false negatives) are both detrimental to furthering our understanding of the human body. Still, false positives have a much greater potential to cause harm. For example, suppose we set the significance level in a clinical trial too high. In that case, we may reject the null hypothesis that the procedure is not more effective than a placebo, and as a result, we may believe a medical procedure is effective when it is not. As a result, we want to choose a significant level that minimizes the likelihood of a false discovery. Although significance levels of 0.05 are standard in many fields, we may want to select a much lower threshold when determining the effectiveness of medical procedures or testing the predictive abilities of machine learning algorithms in biomedical fields.
🧬 Exercise Physiology Case Study
Muscle oxygenation (SmO₂ ) can help athletes understand how their body responds to different types of exercise and make informed decisions about training intensity and duration, recovery, and other factors impacting performance. Additionally, SmO₂ gives a more reliable indicator of physical exertion than heart rate (HR).
In a study titled Near-Infrared Spectroscopy: More Accurate Than Heart Rate for Monitoring Intensity in Running in Hilly Terrain, scientists found that while heart rate was unaffected by continuous changes in terrain and intensity during exercise, muscle oxygenation (SmO₂) reflected these changes and strongly correlated with changes in oxygen consumption. These findings suggest that SmO₂ may offer a more accurate alternative to HR for monitoring exercise intensity, particularly over mixed terrain.
At this point, it’s clear that muscle oxygenation can match, or even outperform, other common physiological markers for quantifying exercise intensity. But, in this case study, I want to explore whether an athlete’s maximal deoxygenation ability is meaningfully associated with an athlete’s maximal power output at the end of a ramp incremental exercise test.

Each subject (n=25) in this experiment performed a ramp incremental exercise test beginning with a 10:00 warmup followed by progressive increases in power every 4:00 until volitional failure. In the image above, you'll find an exemplary SmO₂ and power trend for a single rider. At the end of the test, we recorded the rider's SmO₂ and their maximal power output. Below is a scatterplot comparing each rider's minimum SmO2 and peak power output with summary statistics for the experiment overlaid in the top right corner.

To reiterate the question we are trying to answer, is an athlete’s minimum muscle oxygenation level (SmO₂ Min) during maximal effort exercise a meaningful predictor of their peak power output? This experiment is a Bernoulli trial, meaning there are two possible mutually exclusive outcomes — the null hypothesis (H0) and alternative hypothesis (H1) which are as follows:
Null hypothesis (H0): there is no relationship between minimum muscle oxygenation and peak power during exercise.
Alternative hypothesis (H1): there is a relationship between minimum muscle oxygenation and peak power during exercise.
To determine whether a cyclist's minimum muscle oxygenation level during maximal effort exercise is a meaningful predictor of their peak power output, we'll need to correlate these two metrics across our test population (n=25) and then determine whether this correlation is statistically significant. We can use the formula below to calculate the correlations between our two variables. Before doing so, we need to set our significance level (α), which we can think of as the probability of rejecting H0 when H0 is true. In this case, we can select an α of 0.02.
r = Σ((xᵢ-x̄)(yᵢ-ȳ))/√(Σ(xᵢ-x̄)²)√(Σ(yᵢ-ȳ)²) = -0.81
Next, we need to determine a test statistic that can describe how far our observed correlation is from the null hypothesis, which states that there is no relationship between SmO2 Min and Power Max. The test statistic can is calculated as follows:
t-statistic = r√(n-1) / √(1-r²) = 6.62
Finally, we can calculate the p-value using the stats.binom_test() function in Python's scipy.stats library, which gives us a value of 0.0000009. Since our p-value is < α, we can reject the null hypothesis and, therefore, conclude that there is a statistically significant relationship between minimum muscle oxygenation (SmO₂ Min) and peak power (Power Max) during exercise.
Earlier, I stated that statistical hypothesis testing aims to accept or reject the default assumption. This is not entirely accurate. P-values are probabilistic, meaning we do not know if the result of a statistical test is true or false. Instead, we only know what is likely. Rejecting the null hypothesis means there is sufficient evidence to suggest the default assumption is not likely. The alternative is that there is insufficient evidence to reject the null hypothesis — now, we may think about this as accepting the null hypothesis, but that’s not entirely accurate. We are not accepting the null hypothesis, which would suggest it is true. Instead, we are failing to reject it. There’s always the possibility that a different experiment will lead us to reject the null hypothesis and accept a new alternative hypothesis (H1).
Before analyzing your data and calculating a p-value, you must select your significance level. Choosing your significance level after calculating your p-value is called p-hacking, which is a way to manipulate your data to make it statistically significant.
P-values cannot show whether the null hypothesis is true or false. Instead, they allow us to make probabilistic claims about a result. Additionally, p-values allow you to reject, or fail to reject, your null hypothesis at a pre-specified significance level based on empirically derived evidence and your chosen statistical test. Importantly, p-values.